On August 1, 2025, CATL (SZ300750) had pulled back about 11% from its 52-week high and closed at 255.11 yuan. Market sentiment was relatively weak at the time, and the stock had not entered a new-high zone. But from a CANSLIM perspective, several key signals were already visible: quarterly profit growth of 28%, five-year net profit CAGR of 66.47%, institutional holdings up 22.5%, and a stable shareholder base for three consecutive quarters. Over the following 90 days, the stock rose as much as 63.62%, with a maximum drawdown of -2.10%.
This article uses this historical case to review how CANSLIM’s seven dimensions can help identify signals in a leading stock during a volatile market. It does not predict price movements and does not constitute investment advice; it is intended only as a reusable research framework.
CANSLIM Seven-Dimension Review: What signals were clearer on August 1?
C | Current Earnings | Fair | Current earnings were still growing, but future delivery remained important
The latest quarterly data showed CATL’s net profit grew 28% year over year, EPS grew 34%, and quarterly ROE was 5.60%. Earnings acceleration was +20.48%. These figures indicate that the company’s current-quarter earnings were still growing at that time.
However, current-quarter growth still needs to be compared with subsequent financial reports. If future earnings fail to continue, the market may reassess expectations.
A | Annual Earnings | Relatively Strong | A long-term growth record was one of the key fundamental supports
Over the past five years, CATL’s net profit CAGR was 66.47%, and revenue grew at a five-year compound rate of 53.19%.
The company maintained positive growth for five consecutive years. Analysts expected 2025 net profit growth to reach 31%.
This means that when the market assessed CATL at that time, it was not only looking at a single quarter, but also at the continuity of earnings growth over the past several years.
N | New Highs and Innovation | Needs Observation | There was still distance from the prior high, so the quality of the recovery mattered more
On August 1, CATL was still about 11% below its 52-week high.
This means the stock had not yet returned to a new-high area.
The more important questions were whether the stock could continue to recover, whether there would be new fundamental catalysts, and whether it could gradually approach or break above the prior high.
S | Supply and Demand | Relatively Stable | No obvious shareholder dispersion was a signal worth tracking
Over the previous three quarters, CATL’s shareholder count remained roughly around 226,000.
This suggests that the shareholder structure had not shown a rapid and obvious dispersion.
In the CANSLIM framework, supply and demand are not only about trading volume; shareholder stability is also part of the observation.
L | Leader or Laggard | Mixed | Fundamental leadership was clear, but relative price strength still had room to improve
CATL is a global leader in power batteries, with a leading market share.
However, on August 1, 2025, its relative strength score was 50, and its industry ranking was 93.
Therefore, the L dimension needs to be separated into two parts: the company’s industry position was strong, but its stock-price relative strength was not especially outstanding at that point.
I | Institutional Sponsorship | Slightly Positive | Higher institutional holdings provided a fund-flow support signal
From the end of 2023 to the end of 2024, institutional holdings increased from 546.66 million shares to 669.70 million shares.
That represented an increase of 22.5%. Higher institutional holdings suggested that medium- to long-term capital was still involved.
But this does not mean the stock price would necessarily continue rising. A more reasonable interpretation is that there was no obvious sign of institutional exit at that time.
M | Market Direction | Slightly Positive
At that time, the market index stood above its 50-day moving average, and the 50-day moving average was trending upward.
This suggests that the broader market environment was not weak. For a large-cap growth stock, the market environment matters.
On August 1, the market trend did not create an obvious drag on CATL.
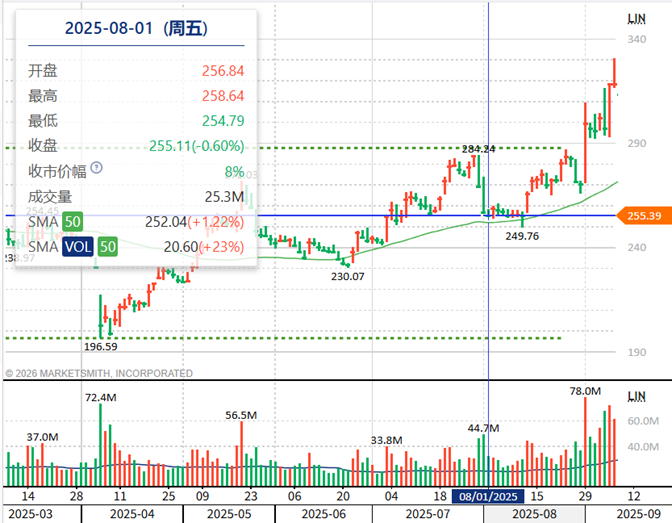
Looking at the chart at that time, CATL was trading near its MA50 and remained above the moving average, but it was still some distance from its previous high. This was more like an observation point during a recovery process, rather than a confirmed new-high breakout stage. What needed to be monitored next was whether the stock could hold above key moving averages, whether volume could support the move, and whether the price could gradually recover toward the prior high.
Historical Validation: What happened over the following 90 days?
Using the August 1, 2025 closing price of 255.11 yuan as the observation price, the following 90-day data were observed:
| Metric | Data |
| Highest price | 417.40 yuan |
| Maximum gain | +63.62% |
| Day of highest point | Day 69 |
| Maximum drawdown | -2.10% |
| Lowest price | 249.76 yuan |
| Day of lowest point | Day 11 |
| Ending closing price | 391.33 yuan |
| Ending gain | +53.40% |
From the results, CATL later reached a high of 417.40 yuan on Day 69.
Compared with the 255.11 yuan observation price, the maximum gain was 63.62%.
The lowest price during the period was 249.76 yuan, which occurred on Day 11 after the observation date. The maximum drawdown was -2.10%.
By the end of the 90-day validation period, the stock closed at 391.33 yuan, representing an ending gain of 53.40%.
This indicates that the long-term earnings, institutional holdings, current earnings, and market trend signals observed on August 1 were later reflected in a meaningful price move.
However, this is a historical case review. The subsequent gain should not be interpreted as proof that any single indicator will always work.
CANSLIM Takeaways: What does this case suggest?
What makes the CATL case worth reviewing is that not every dimension was especially strong.
For example, the stock was still about 11% below its 52-week high; its relative strength score was 50; and its industry ranking was 93.
On the other hand, its five-year net profit CAGR was 66.47%, five-year revenue CAGR was 53.19%, institutional holdings increased 22.5%, current-quarter net profit grew 28%, EPS grew 34%, and the market index stood above its 50-day moving average.
Taken together, these signals show that the analysis at the time was not about relying on a single indicator.
The role of CANSLIM is more to help investors judge whether a stock has support from fundamentals, fund flows, and the broader market environment at the same time.
Investment Observation Summary
Strengths
- Five-year net profit CAGR: 66.47%.
- Five-year revenue CAGR: 53.19%.
- Institutional holdings increased 22.5% year over year.
- Latest quarterly net profit grew 28% year over year, and EPS grew 34%.
- Shareholder count remained roughly around 226,000 over the previous three quarters.
- Maximum gain within the following 90 days was 63.62%.
Areas that still required monitoring
- At the time, the stock was still about 11% below its 52-week high.
- The relative strength score was 50.
- The industry ranking was 93.
- Whether the stock could approach the prior high again still required validation from subsequent price action.
This article is for CANSLIM methodology education and historical case review only. It does not constitute investment advice. Past performance does not represent future returns. Markets involve risk, and investors should act prudently.
Published on Jun 09, 2026